
Innowatts.
AI-driven energy forecasting made modular, scalable, and user-friendly.
About the product.
Innowatts is a SaaS platform for energy providers. It helps them forecast demand, manage risk, and extract insights from massive meter-level data. The core challenge was that the technical models were powerful, but the user experience was bespoke per client, slow to scale, and slow to adapt.
I led the redesign to transform it into a modular, reusable, scalable ecosystem without losing depth or capability.
My role: Senior Product Designer
(Discovery, strategy, architecture, prototyping, design system, handoff, mentoring)
Timeline: Jul 2021 – Jan 2023
Results.
%
Faster client implementation
%
Faster Onboarding of new users
%
Faster feature delivery
%
Cheaper infrastructure cost per client
Design approach.
Understand → Create ←→ Validate→ Deliver
The problem.

Clients used many custom setups and spreadsheets. The AI model outputs were too large for practical dashboards.
Each client had a tailored experience, which meant high cost, long delivery, and inconsistent UX.
As a result:
- Implementation took too long.
- Onboarding was cumbersome.
- Feature rollout was slow and risky.
- Scalability was limited.
Discovery & Research.
I began with sessions and stakeholder interviews (PMs, engineers, data scientists, client leads). We mapped workflows, pain points and expectations.
Key findings:
- Model outputs were massive. Users struggled to digest raw data.
- Clients want flexibility but not infinite complexity.
- Some features were repeated in bespoke forms across clients.
- Any architecture change needs to support future expansion.
Personas.


We built role-based personas for forecasters, risk analysts, and operations.
The goal was alignment across shared flows. Each role touched different tools and insights, then handed outcomes to the next step in the journey.
Mapping the journey.
We built personas based on different roles (forecasters, risk analysts, operations and more) to keep us aligned while solving interconnected flows on which multiple participants can iterate on one specific flow, each one of them might use a different tool, insight or have a completely different goal that might be required by any other user later on their journey.
The map exposed approval bottlenecks, repeated manual edits, and risky handoffs. It also showed where an adjusted forecast should become a portable unit. InnoPods solved that handoff.

Understand → Create ←→ Validate→ Deliver
Information architecture.
We introduced InnoPods: standardized, modular data units. Each InnoPod packages a clean, well-structured dataset or insight (forecast, anomaly, scenario) that can plug into dashboards or tools.
Tools were defined as functional modules for data exploration, forecast adjustments, load scheduling, smart engagement, pricing, and alerts.
These became the core levers for analysts and operators.
Each tool reads or writes InnoPods. This kept the model simple for users and consistent for delivery.

Final information architecture.

IA Highlights:
- The overall app was segmented by user role and tools (forecasting, scenario analysis, alerts, dashboards).
- Each module receives or publishes InnoPods.
- Users see only what’s relevant to their role.
- Modules interoperate; no monolithic “one UI to rule them all”.
This approach supports reuse, faster development, and clearer mental models for users.
Design & Prototyping.

Starting from sketches and whiteboards, I mapped flows, user paths, data handoffs. Then we moved to mockups and interactive prototypes in Figma.
We iterated with engineering and stakeholders to test edge cases (performance, data lags, mismatches).
Thunderbolt design system.
With the patterns set, we created Thunderbolt, the Innowatts design system. Components map to InnoPods and tools, so behaviors repeat and delivery stays fast.
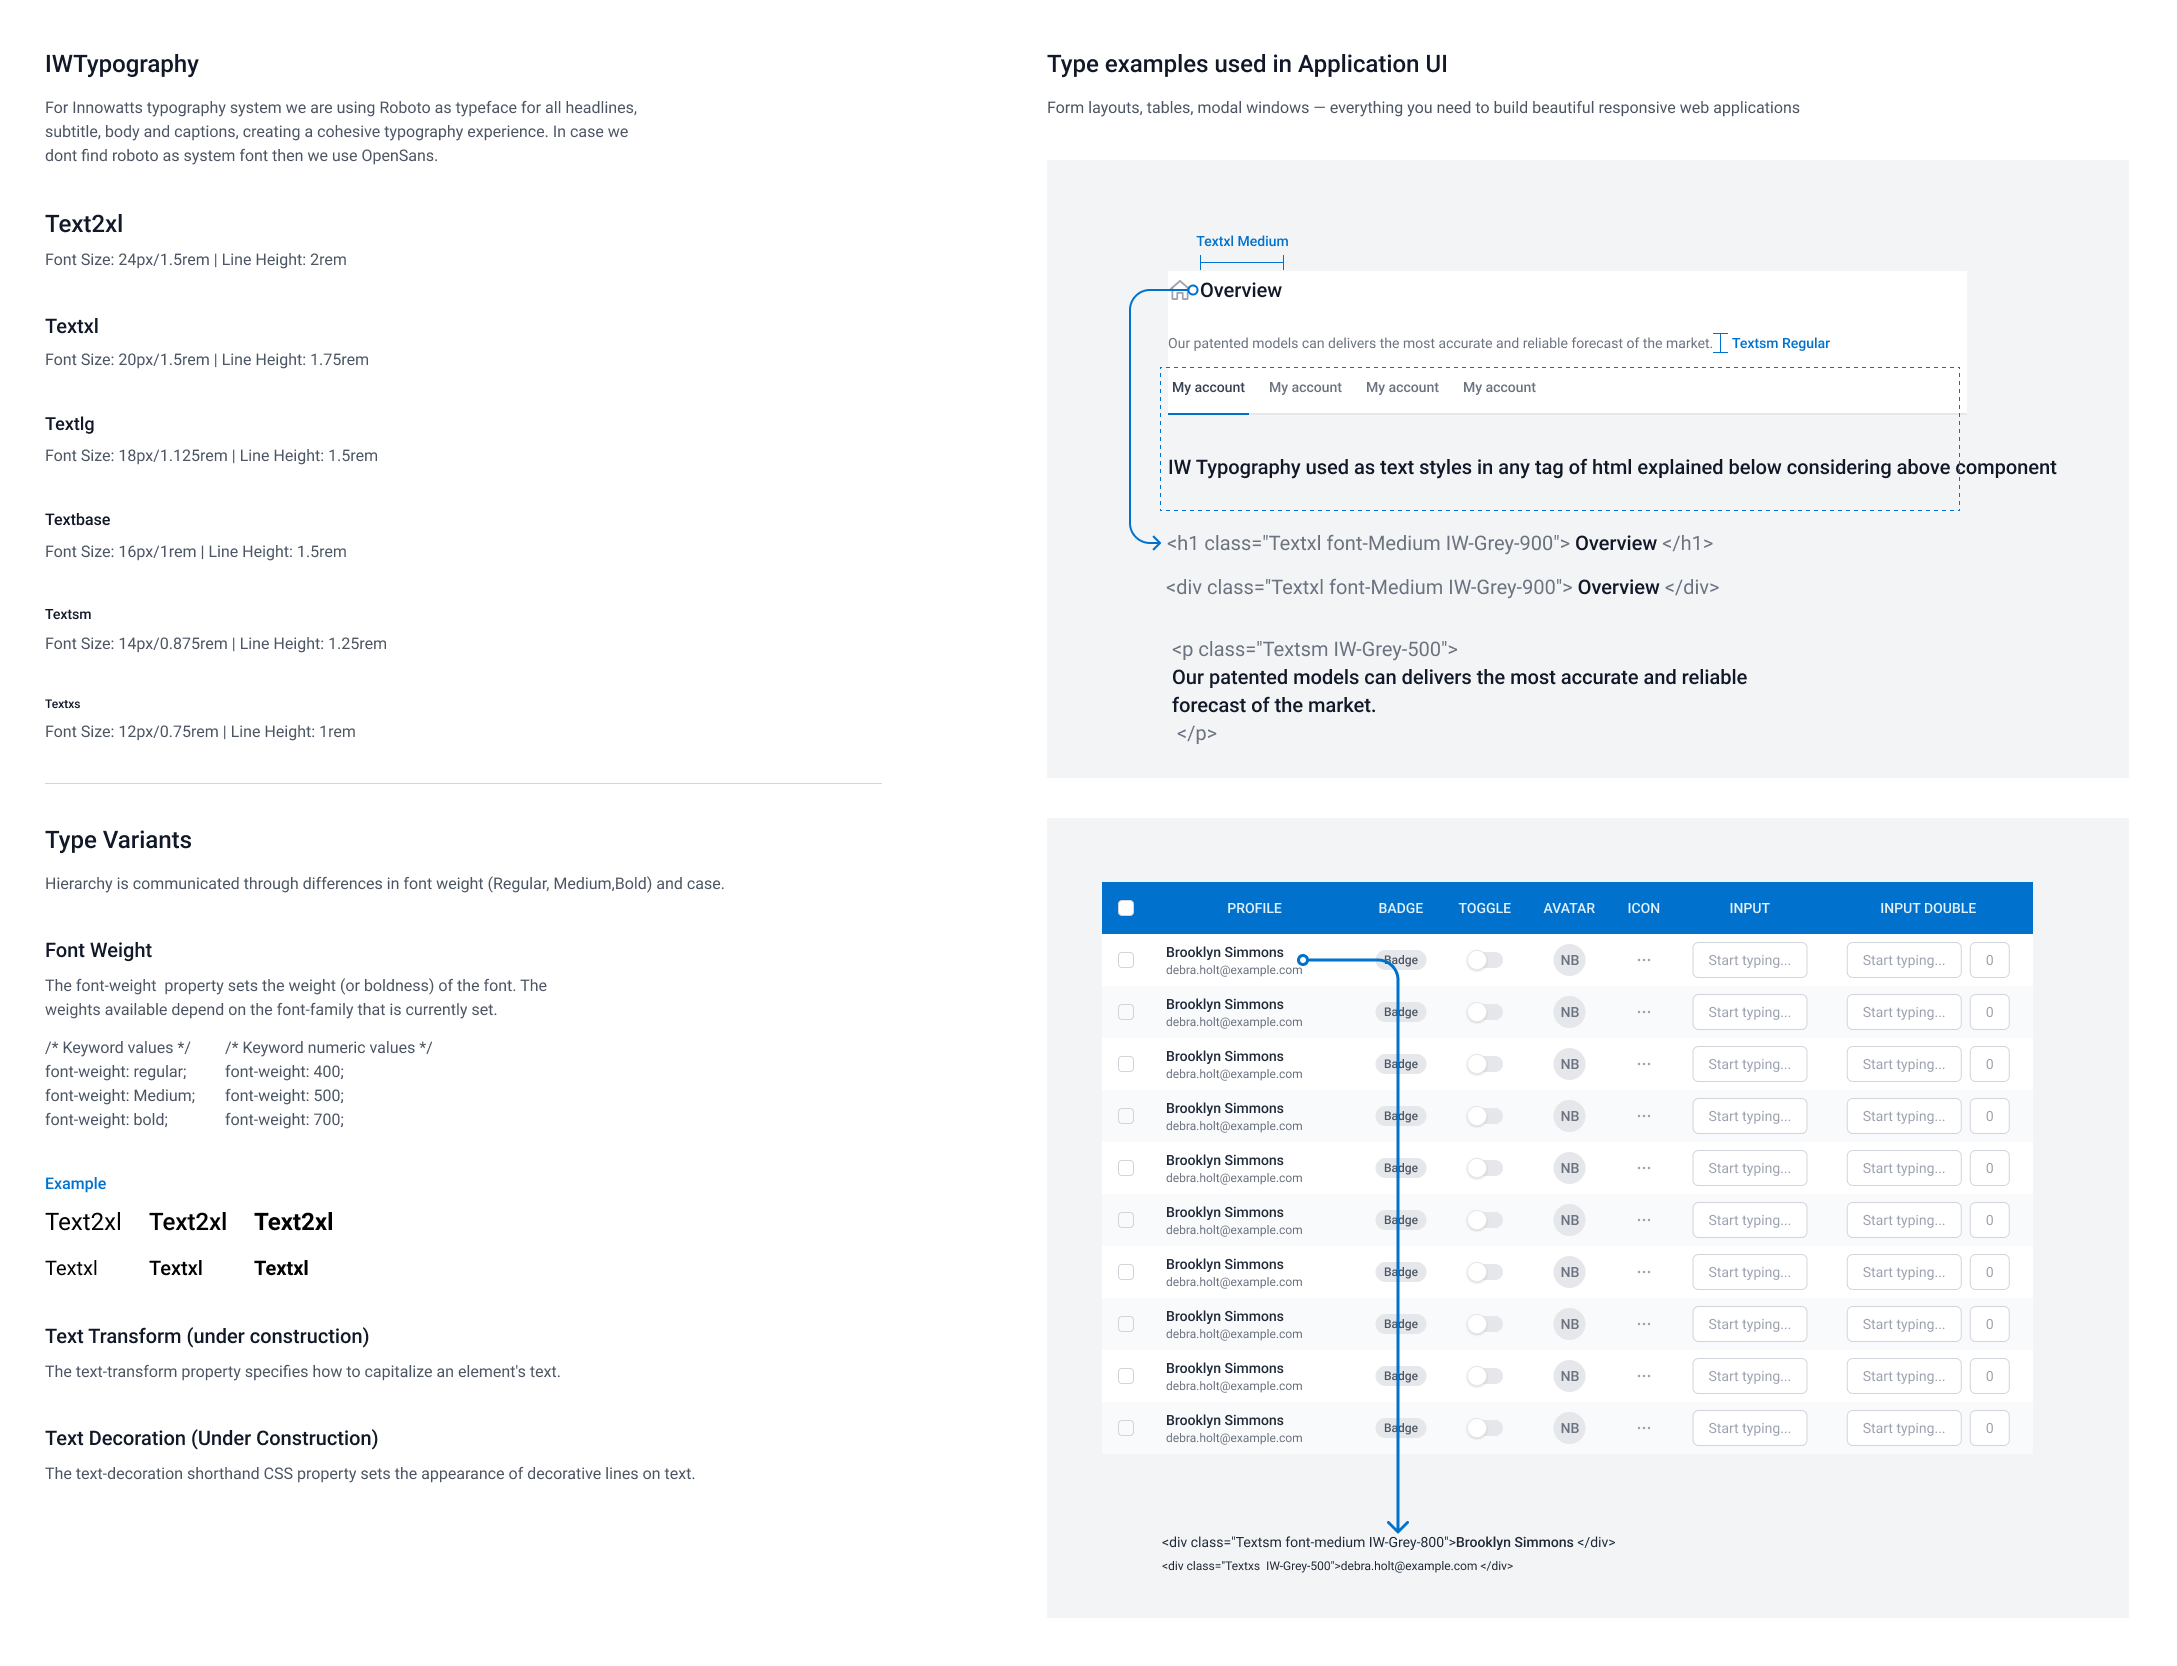
Innowatts – Design System – Typography
Innowatts – Design System – Typography
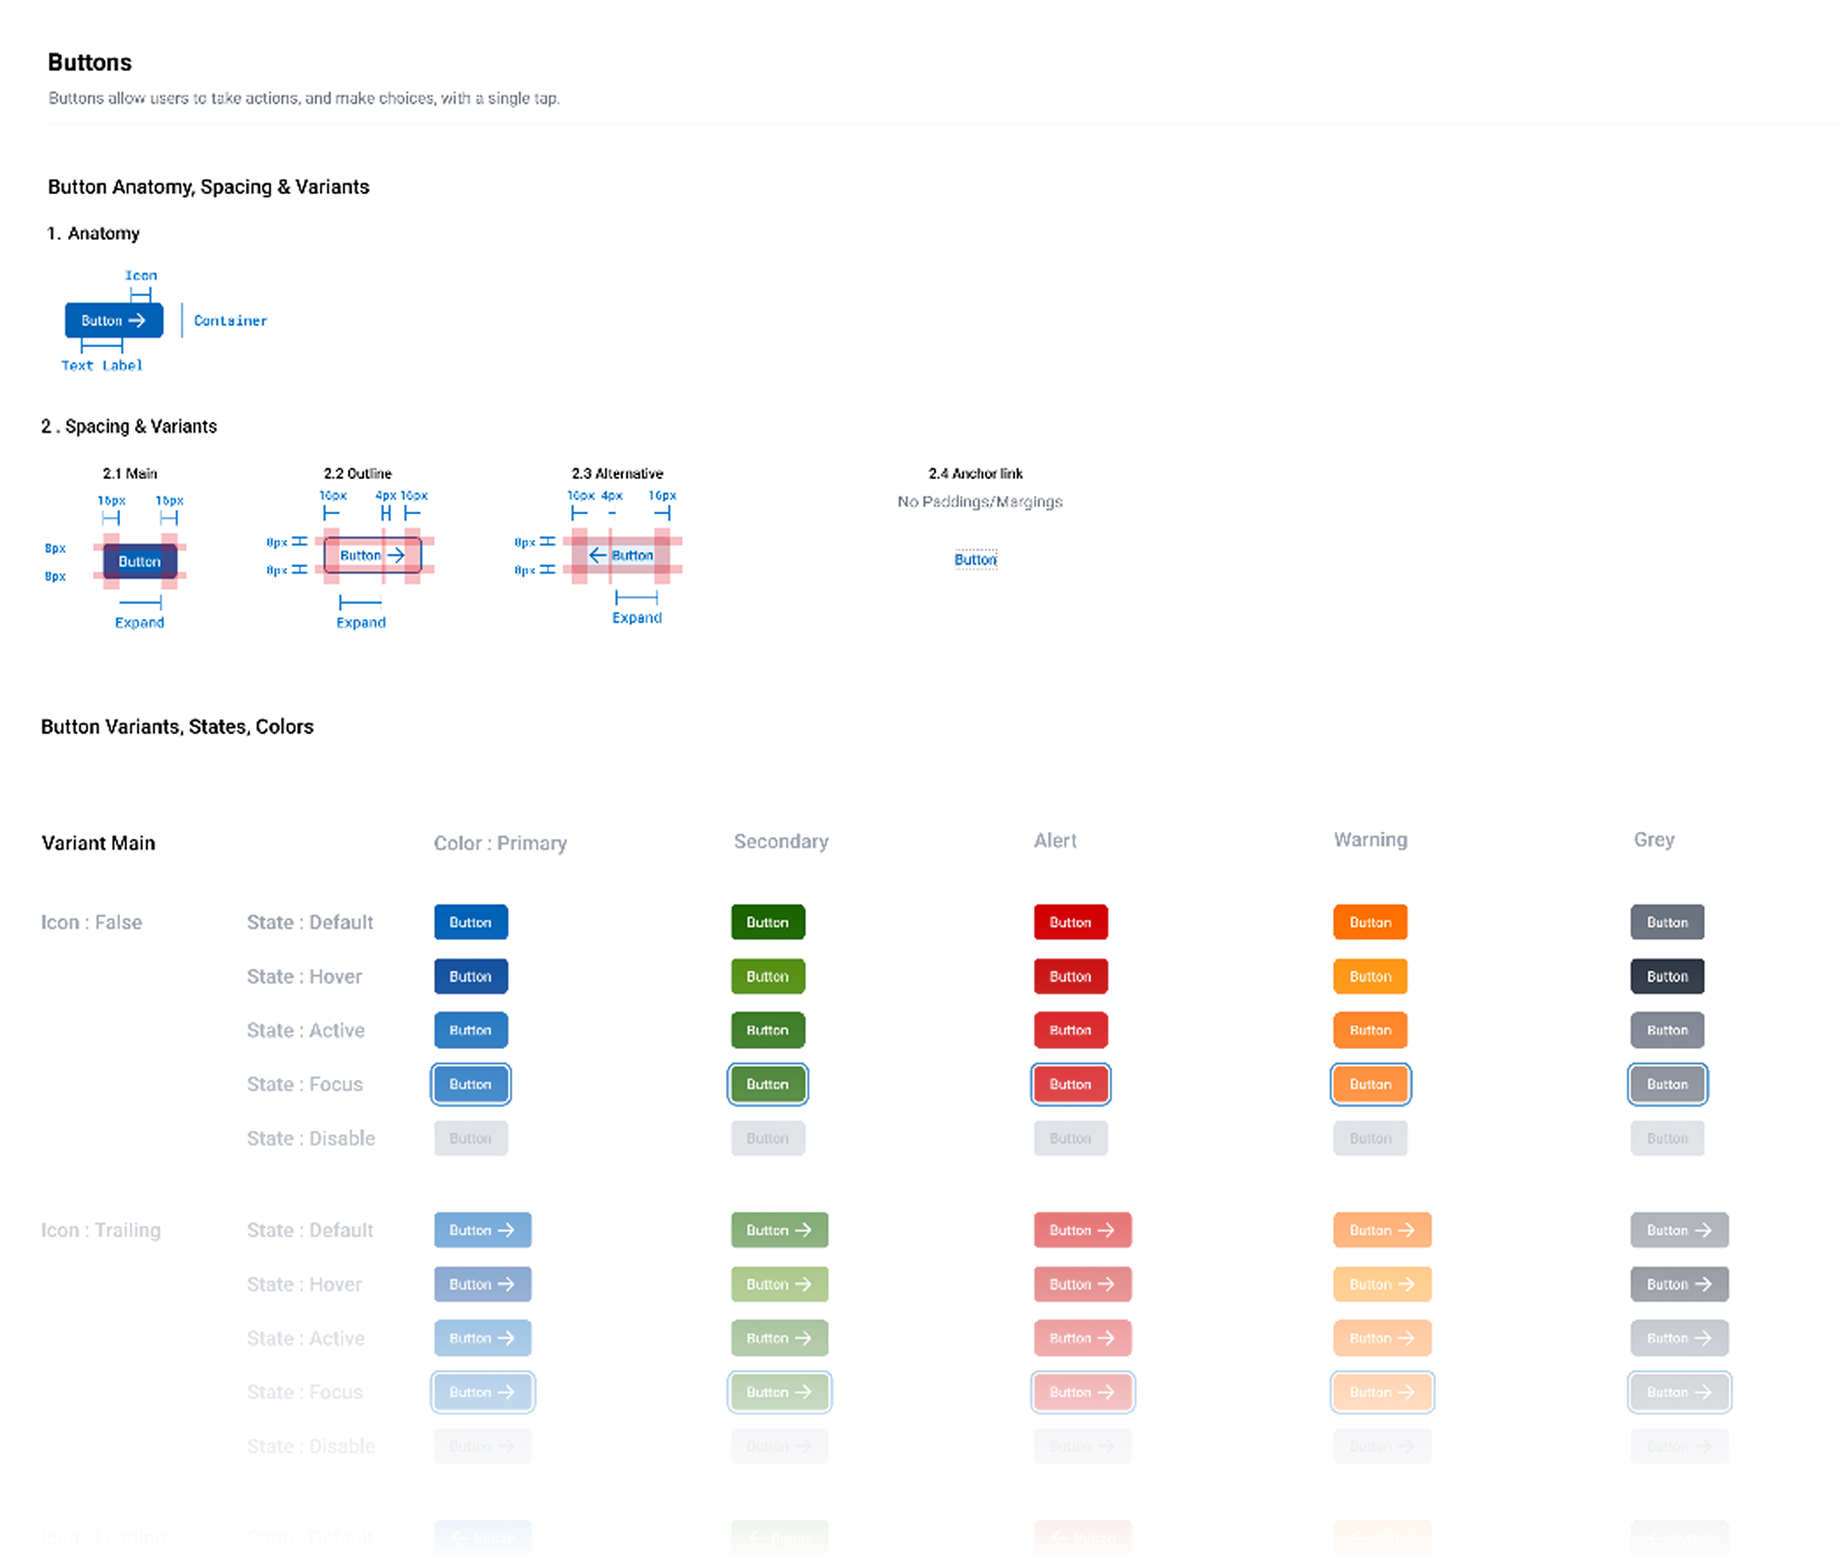
Innowatts – Design System – Buttons
Innowatts – Design System – Buttons
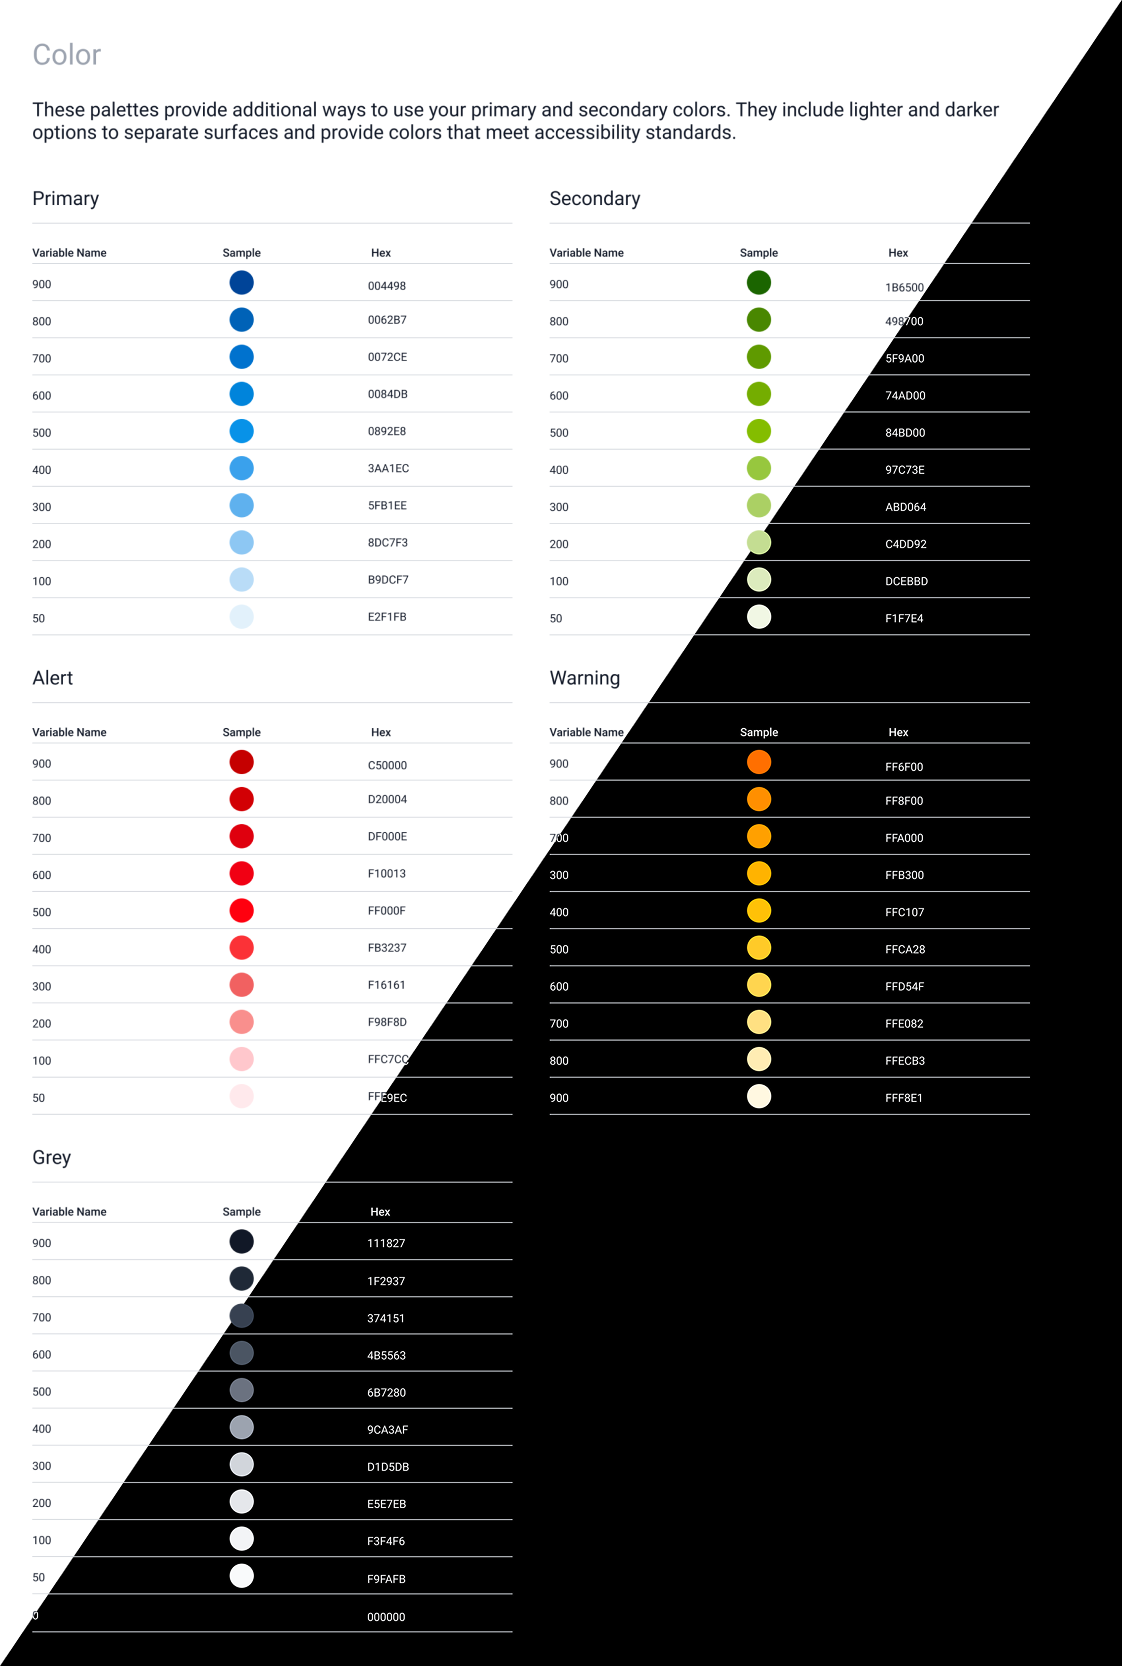
Innowatts – Design System – Colors
Innowatts – Design System – Colors
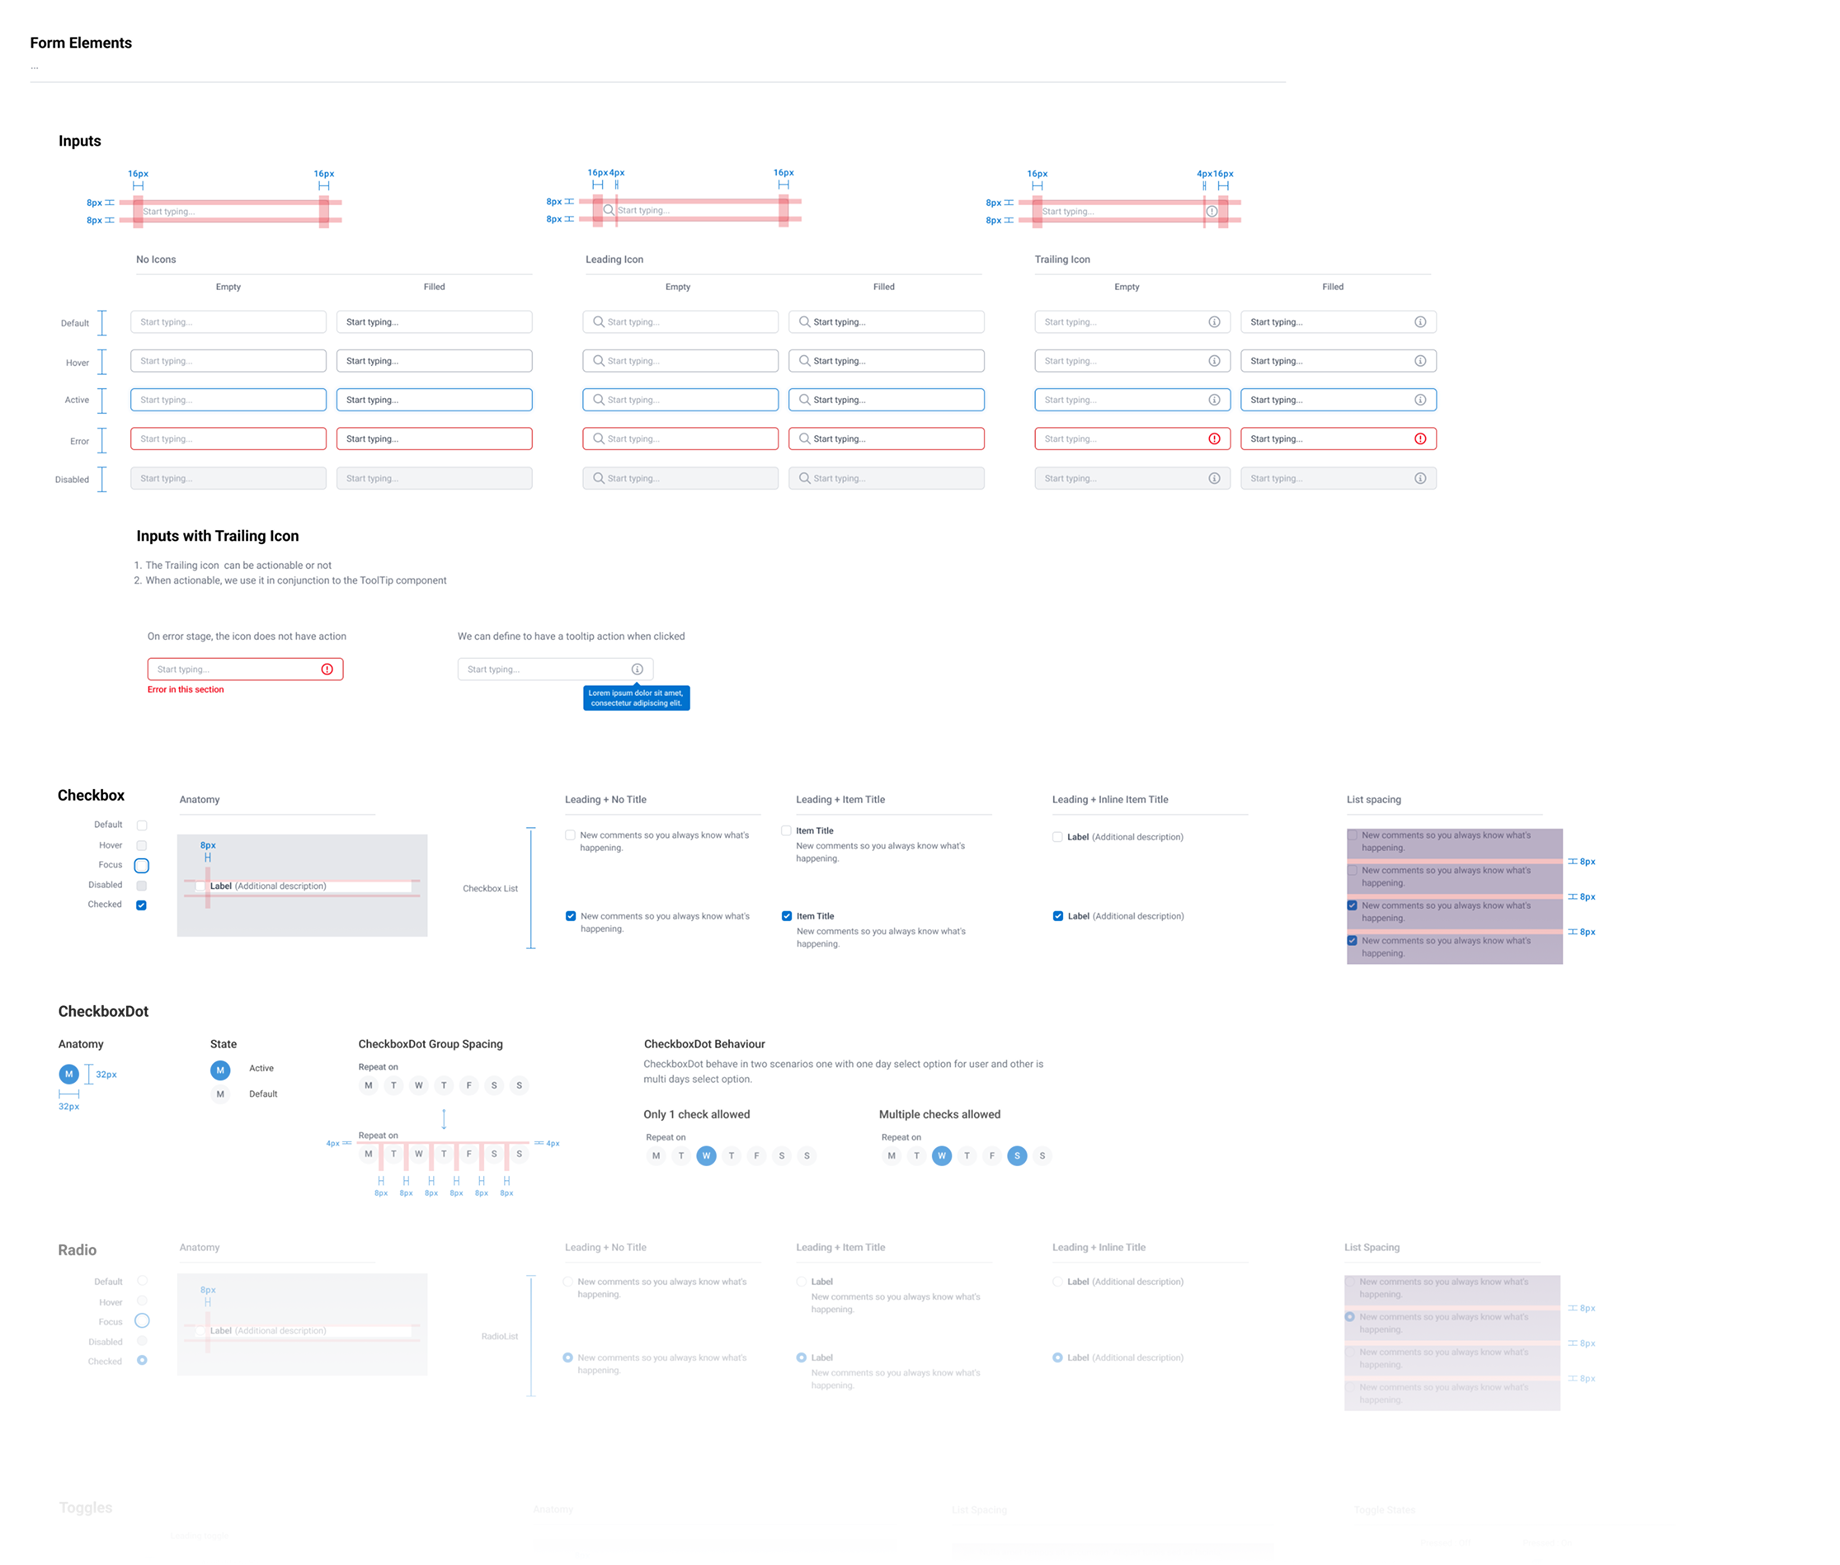
Innowatts – Design System – Form elements
Innowatts – Design System – Form elements
Innowatts – Design System – Icons
Innowatts – Design System – Icons
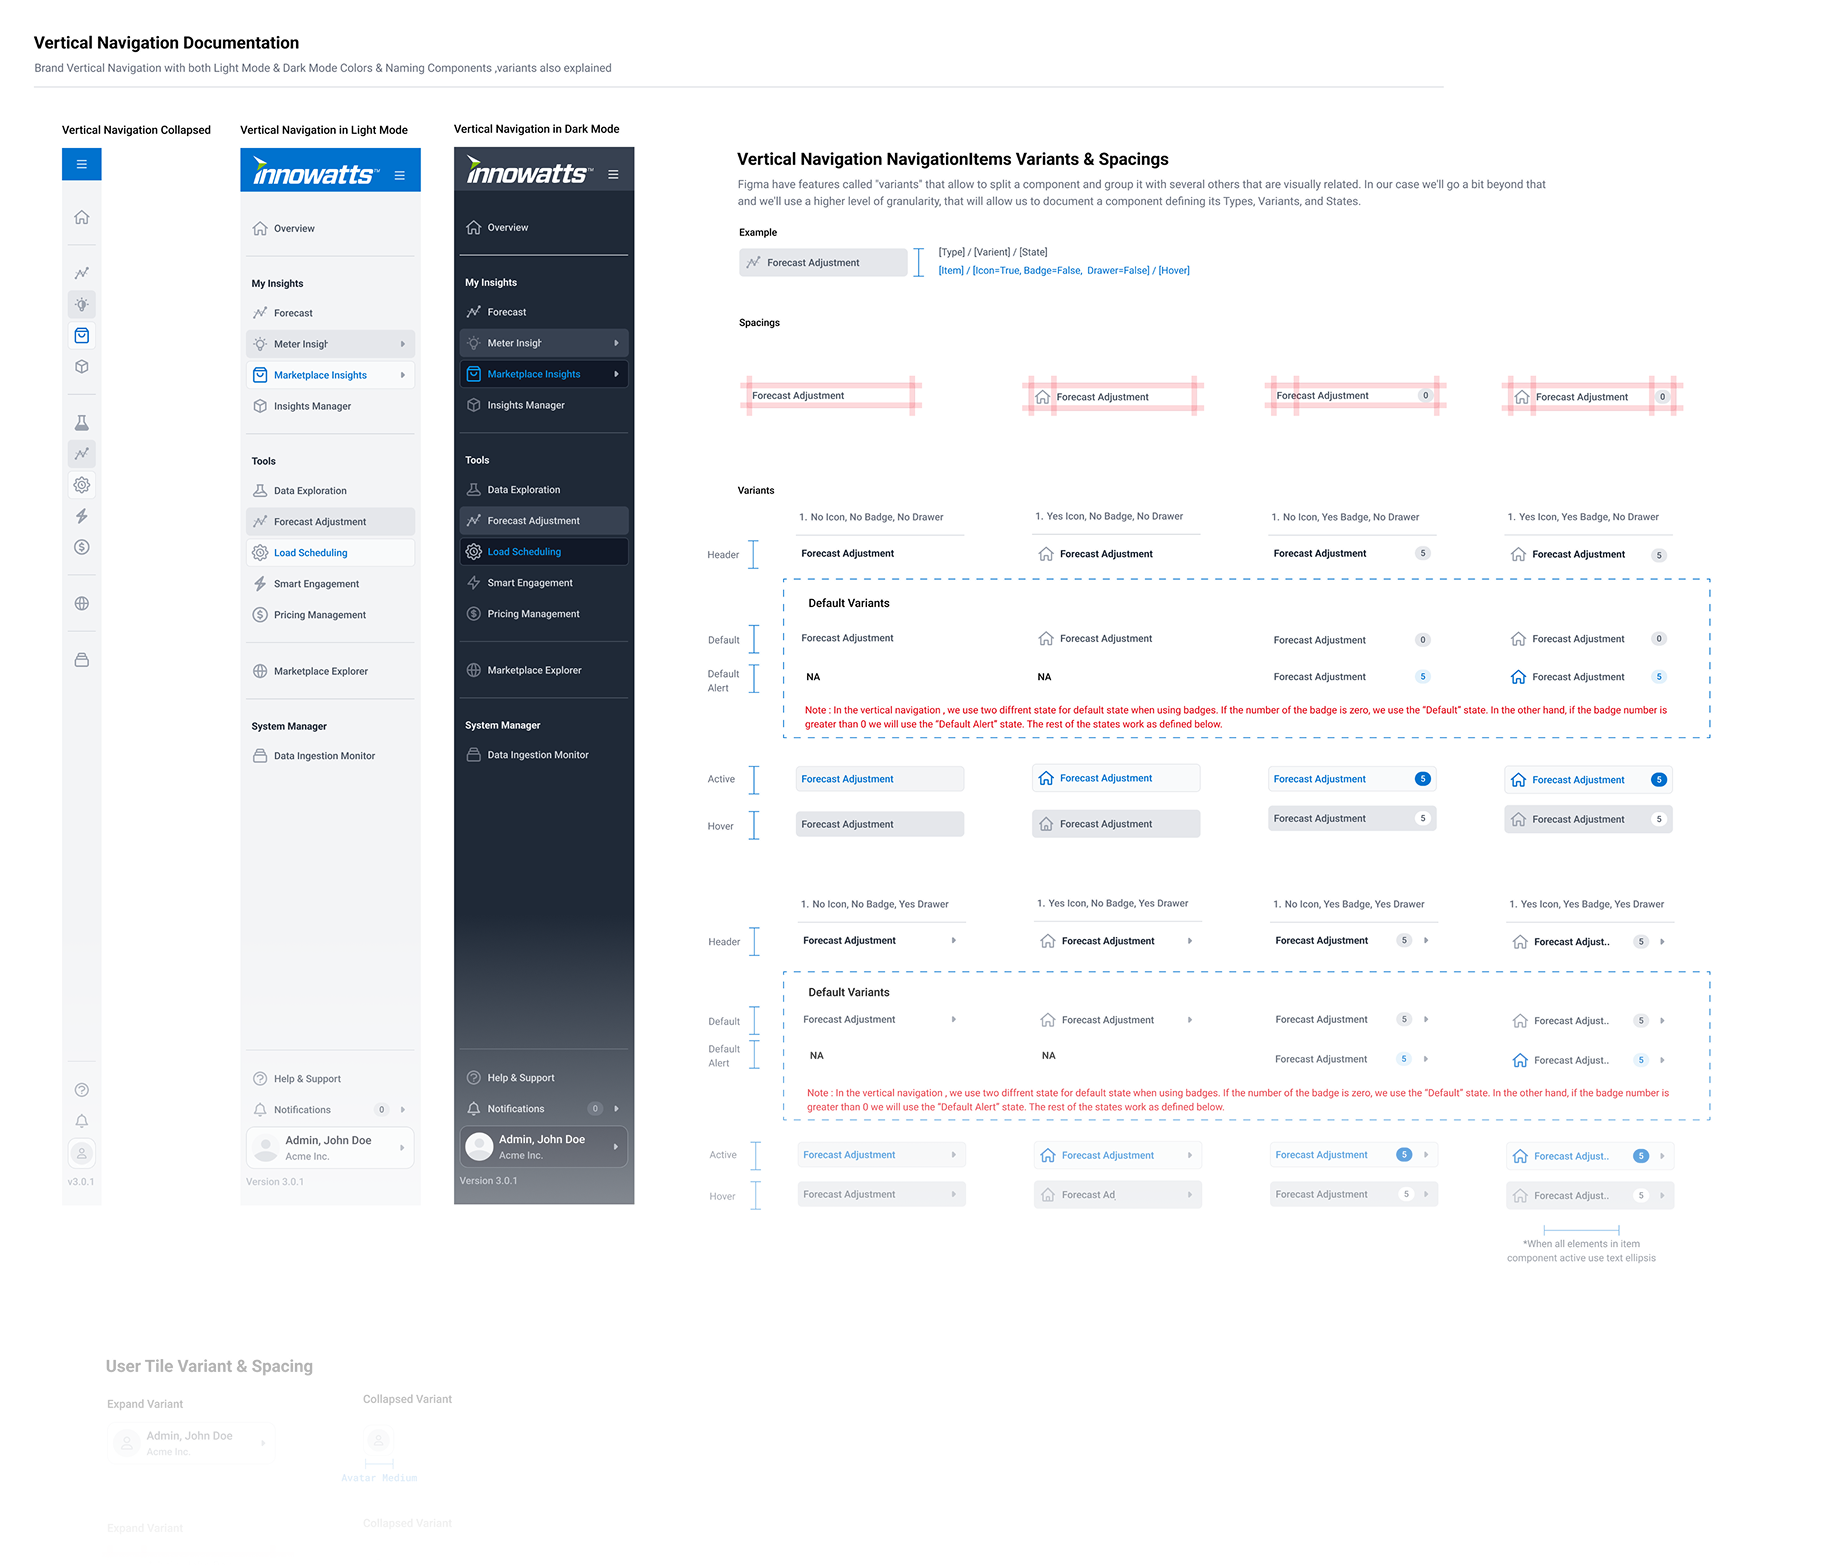
Innowatts – Design System – Navigation Bar
Innowatts – Design System – Navigation Bar
Hi-fidelity mockups.


InnoPod card component anatomy.

Understand → Create ←→ Validate→ Deliver
Testing & Iteration.
Interactive prototypes were created to validate the new modular workflows and information architecture. We tested them with stakeholders and end users to check if InnoPods moved smoothly across tools and if tasks like creating, adjusting, and approving forecasts were clear.
Feedback from these sessions drove rapid iteration. Each cycle helped refine interactions, edge cases, and system logic before development started. The prototypes became both a validation tool and a shared reference point for design, product, and engineering.
Real behaviours, real design choices.

To validate the visualization workflow, we ran an A/B test comparing two layouts for configuring forecasts:
- Variant A: a dense, expert-oriented pattern where all configuration options are visible and grouped by detail.
- Variant B: a progressive, guided pattern where configuration is simplified into drag-and-drop, lowering cognitive load.
The test wasn’t only about visual placement, it was about how users interact with complex data configuration. One pattern favored speed and control, the other helped clarity and accessibility.
We measured:
- Time to set up a new visualization.
- Error rate when selecting dimensions.
- User preference for clarity vs. speed.
Findings:
The test compared two different configuration patterns. Variant A gave expert users faster access to all options at once, while Variant B simplified the workflow into drag-and-drop steps, reducing cognitive load. Variant B proved easier for new users, cutting errors by 20%.
Decision:
We adopted Variant B as the default pattern to prioritise clarity and adoption. To balance expert needs, we added advanced toggle settings to the backlog for later release.
Understand → Create ←→ Validate→ Deliver
Handoff & Launch.
I was present during the full dev cycle. Handoff was seamless thanks to:
- Detailed Figma specs with notes.
- Story-level flows and Storybook integration, along with component specifications from Figma.
- Screen recordings with voice-over explanations.
Before each release, I helped to QA-test the staging environment:
- Flagged UI inconsistencies and bugs.
- Validated design implementation.
I also contributed to PM activities:
- Performed multiple customer-facing demos.
- Market research and feature prioritization matrix.
- Creation of PDF guides and training videos for seamless onboarding.
Outcomes.
Delighting new customers.
- We reduced implementation time by half by standardizing the ingestion mapping process as a byproduct of the re-architecture required for the implementation of InnoPods.
- Onboarding went from days to hours with the simplified logic of Innopods <> tools dynamic.
- Clients surfaced new module needs (upsell opportunities) more easily.
%
Faster client implementation
%
Faster Onboarding of new users
Product delivery improvements.
- New features were released in a single sprint because each tool was architected as a self-contained unit, built with components from the Thunderbolt Design System.
- The design principles became embedded in the product strategy.
- The InnoPod approach helped to cut infrastructure costs per client by 40%. By rearchitecting the system as microservices, we eliminated the need to replicate implementations for every new customer onboarding.
%
Faster feature delivery
%